02
Holding Q4 delivery windows
Dropped loads and chargebacks during high-volume weeks, solved with dedicated dry-van lanes plus vetted overflow capacity.
[X]%
Dedicated CapacityOn-time performance through peak for [Retailer].
Pending

See how shippers use Ship Smart Solutions’ asset-based capacity to solve real freight problems, from protecting cold chains to holding delivery windows in peak season. Each result reflects owned-fleet reliability and one accountable team.
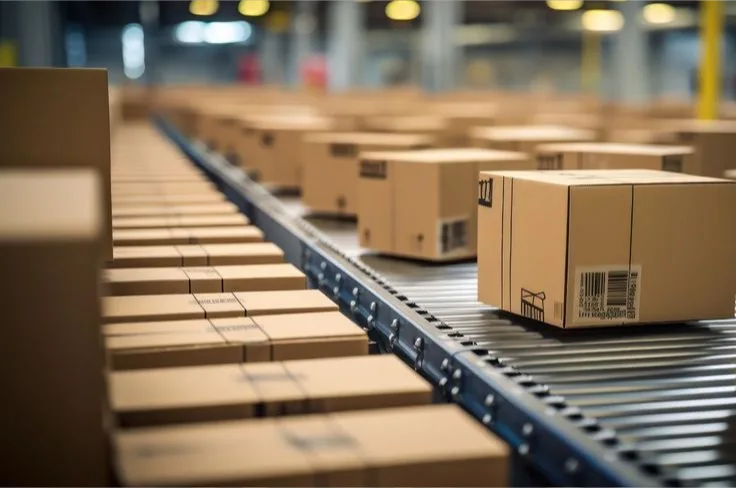
The four outcome categories our case studies report against. Figures stay marked pending until the shipper approves them.
Fewer temperature claims on cold-chain programs.
PendingOn-time performance held through peak season.
PendingIncidents on permitted oversized moves.
Operating view across fleet, overflow, and facilities.
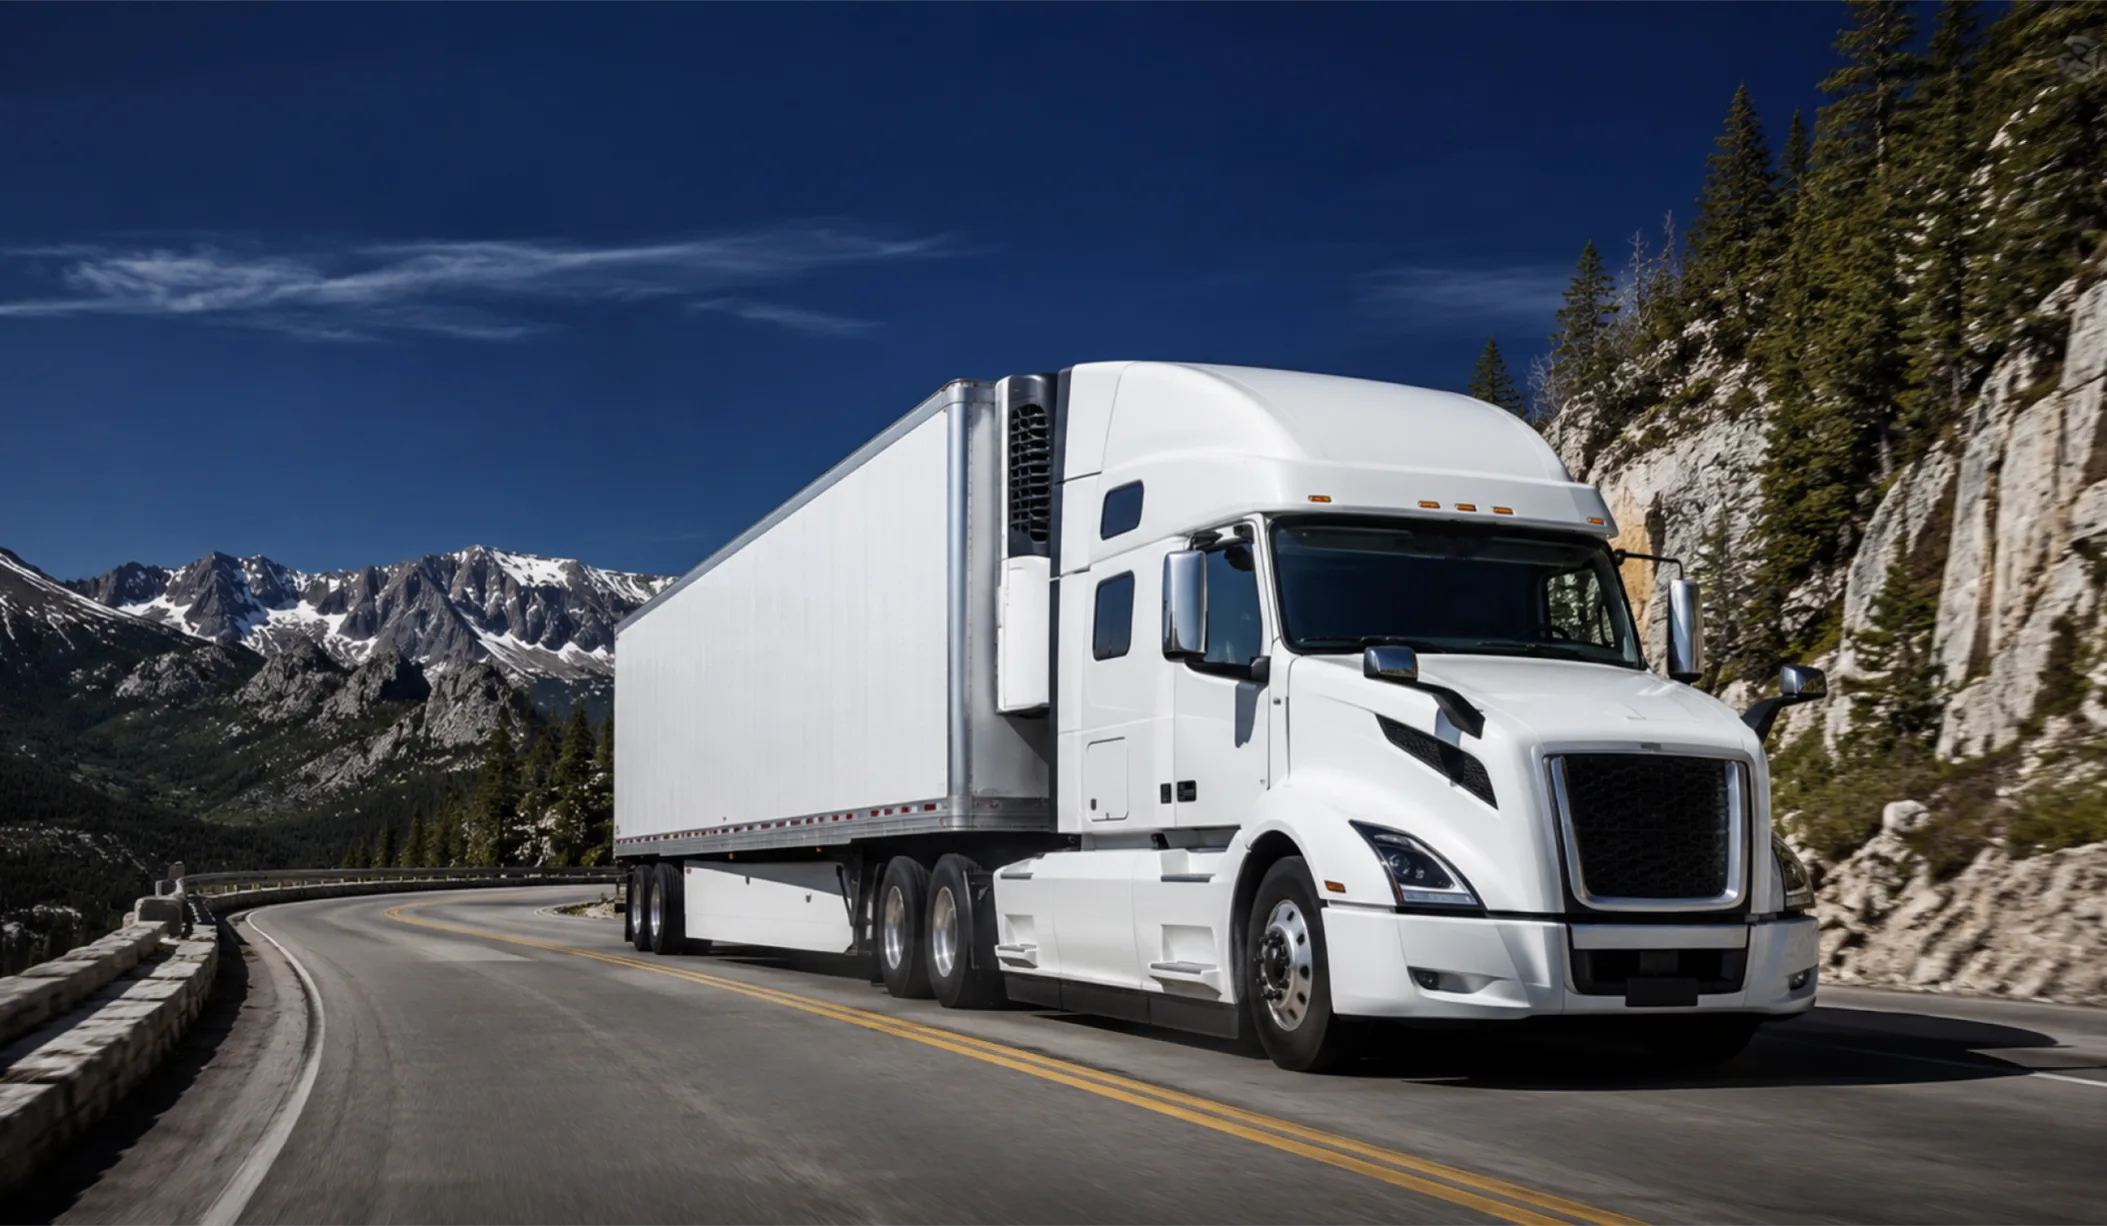
A food distributor was losing product and margin to temperature claims on brokered reefer freight.
Examples of freight challenges addressed through coordinated capacity, visibility, and accountable execution.
02
Dropped loads and chargebacks during high-volume weeks, solved with dedicated dry-van lanes plus vetted overflow capacity.
On-time performance through peak for [Retailer].
03
Over-dimensional equipment with route, permit, and escort dependencies, surveyed, permitted, and executed under one owner.
Incidents, with on-time delivery for [Manufacturer].
04
Delays between warehouse release and carrier pickup, removed by connecting 3PL storage directly to owned transportation.
Days faster fulfillment for [Brand].
Behind every story is the same measurement layer, milestones, temperature records, appointment data, and delivery documents. See Real-Time Tracking .
A strong case study shows the baseline, the intervention, the measurement window, and the source of the number.
01
Establish the baseline
Document the original claim rate, tender acceptance, on-time performance, or fulfillment cycle.
02
Define the intervention
Name what changed, dedicated equipment, owned-fleet coverage, monitoring, or vetted overflow.
03
Measure the same outcome
Compare equivalent periods, lanes, and conditions using customer-approved source data.
04
Approve attribution
Confirm the customer descriptor, result, timeframe, and methodology before publication.
Lane profiles and performance drivers differ by industry. Our team can point you to the most relevant verified example.
Precision Logistics for Industrial Production

Fast Replenishment for Retail Networks
Just-in-Time Transportation

Temperature-Controlled Supply Chain
Heavy Equipment & Project Logistics

Specialized transport for oversized, heavy and complex freight
Reliable Nationwide Distribution
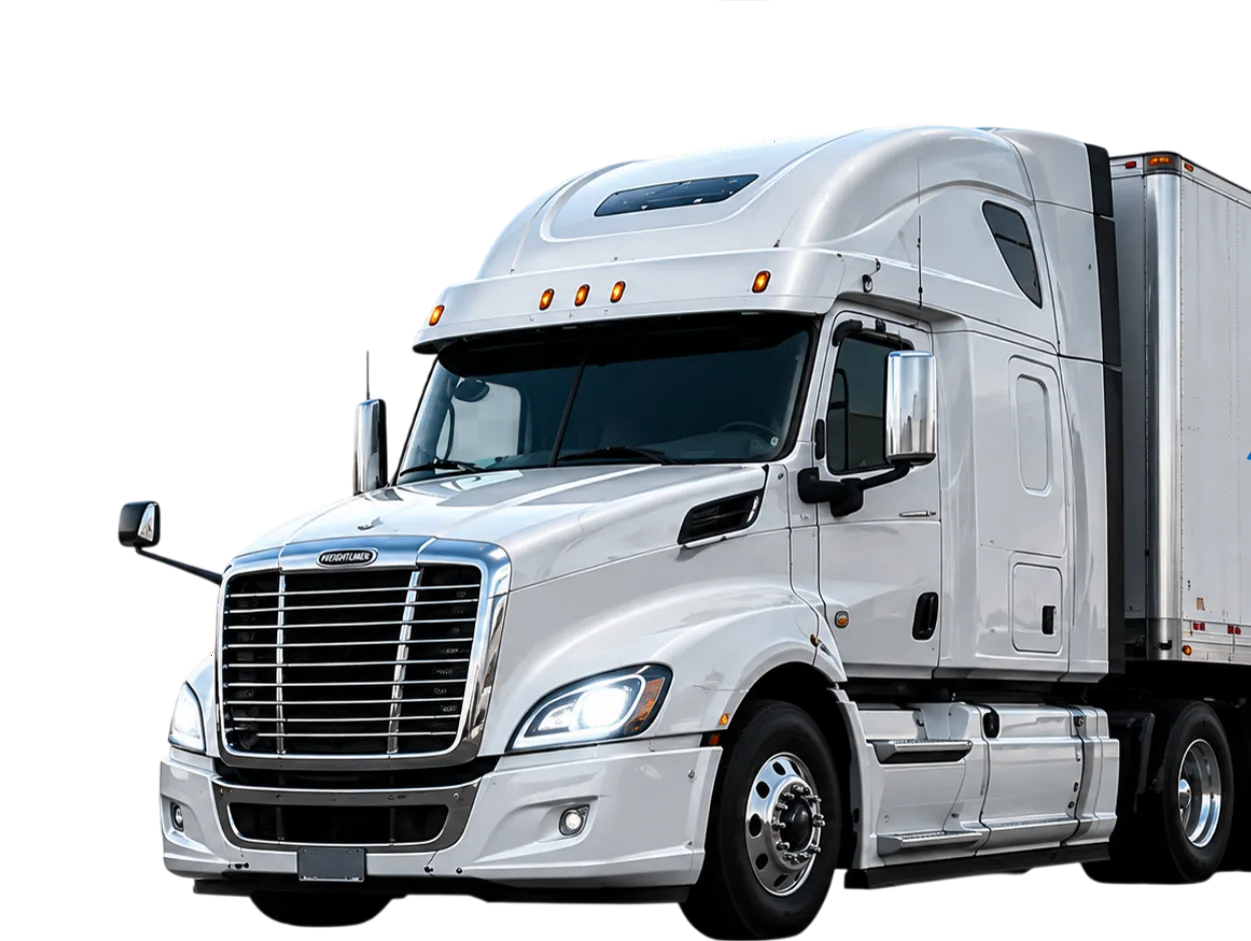
Speed for Modern Commerce

Documented outcomes can include reduced temperature claims, higher on-time performance during peak season, successful oversized moves, and faster fulfillment through connected warehousing and transportation. Published figures should always be verified and attributed.
Yes. Ship Smart Solutions supports food and beverage, retail, manufacturing, construction, automotive, and other industries. Contact the team for the closest verified example.
Results vary by lane, volume, freight type, operating conditions, and program design. Each case study reflects a specific shipper situation and should not be interpreted as a universal guarantee.
Start with a freight quote and lane review. Ship Smart Solutions will evaluate service requirements, equipment, volume, timing, and visibility needs to design the right capacity model.